The late management guru Dr. Peter Drucker said, “What's measured improves.” As with most of Dr. Drucker’s observations, there is a lot of wisdom packed into this brief sentence. All too often, organizations measure things that do not really matter and ignore those things that do matter. In developing agile metrics, we need to begin with what matters.
One of the agile principles states that, “Working software is the primary measure of progress.” If the goal is to produce working software, then our metrics must answer the following questions:
1) Are we building the right features?
2) Is the software of high quality?
3) Are we building the software fast enough?
4) Is the team improving?
Question 1: Are we building the right features?
In agile software development, the team documents the desired software functionality in a list called a backlog. Every entry in the backlog must be estimated by the team and prioritized by the product owner to correspond with the business value of that entry. This is where it gets complicated. What is valuable to one business may not be valuable to another, but following is a partial list of potential attributes of business value:
- Revenue
- Return on Investment
- Time to market (or conversely, cost of delay)
- Alignment with overall corporate objectives such as customer satisfaction or competitive advantage
This list merely scratches the surface. The best business value metrics result from discussions between business and technology leaders and will likely evolve over time.
Question 2: Is the software of high quality?
As noted in an earlier article on Agile Testing, the agile framework is quite disciplined and results in high quality, reliable software that is tested extensively.
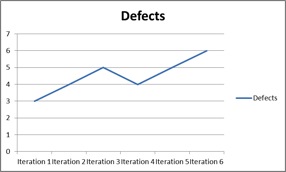
As software problems arise during development and testing, they are added to the backlog and categorized as defects. The team will track the quantity of defects and the trend line of those defects across multiple iterations. The time required to correct these defects competes directly with the time required to produce new features and will therefore slow down the team’s progress, so the team must ensure the defects are reduced and, when they occur, they are corrected efficiently. The following is a sample chart that can be used by a team to monitor the quantity of defects.
Some defects escape capture during development and testing and find their way into production, sometimes by the customer. These defects must be added to the backlog as well, and may require separate reporting since these defects are typical quite visible.
Question 3: Are we building the software fast enough?
Each team must develop its own metrics in order to answer this question. The first step is to understand the size of the backlog in story points, which are estimates of the relative size or complexity of one story compared to another. A simple story might be given one story point, an average story might be 5 points, and an 11-point story would be over twice the size of an average story. The size of the backlog would be the sum of all the story points as depicted below. In this case, the total number of story points in the backlog is 75.

The next step is to determine the team’s velocity, or the number of story points to be completed in a given iteration. For the sake of simplicity, let’s assume that the team has been working together for several months and has determined that they average 25 points during each two-week iteration. Further, let’s assume that they plan to complete the work in the backlog during a release that contains three iterations. The team would track their progress using a “burn down” chart as depicted below:
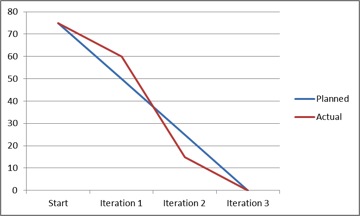
The team receives credit for the points associated with a story only when the product owner accepts the story as “done.” The blue line shows the planned progress of 25 points during each iteration. The red line shows actual results, which indicate that the team fell behind at the beginning but sped up in the last half of the release.
In this sample case, the team tracked progress on a daily basis as each story was accepted and were able to identify in Iteration 1 that they were falling behind. At the end of Iteration 1 the team completed a retrospective that identified opportunities to improve their development processes. They implemented those improvements in Iteration 2, increasing their velocity and allowing them to catch up.
Please note that the team captured metrics in order to answer the question, “Are we building software fast enough” and were able to use these metrics to make the changes required to complete the work on time. As a self-directed team, they did not wait to be told they were behind schedule. They figured it out themselves.
It is important for management to note that, due to relative estimating, each team’s velocity is its own. If this team averages 25 points per iteration, it does not follow that another team with a 50-point velocity is twice as productive. Therefore, management should avoid the temptation to compare one team with another.
Question 4: Is the team improving its ability to deliver?
The 12th Agile principle states, “At regular intervals, the team reflects on how
to become more effective, then tunes and adjusts its behavior accordingly.” This reflection happens at the end of each iteration, when the team simply identifies what activities worked well and what require improvement. Somewhat less frequently, perhaps every 2-3 months the team should conduct a more formal assessment of their performance in key areas of agile performance. The assessment requires that the team score themselves on a number of factors that describe optimal agile team performance. The resultant score can be depicted in a radar chart similar to the one listed below.
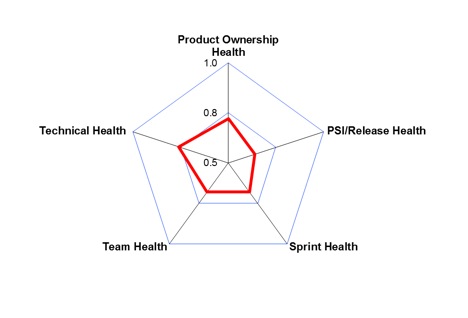
The spreadsheet for this chart, including the team questions, can be downloaded from within the document referenced below as “Scaled Agile Framework – Agile metrics at an enterprise level.” The red lines in the chart above shows that the team is doing pretty well in the category of Technical Health but needs considerable improvement in PSI (Potential Shippable Increment) / Release Health. The team can post the radar chart in the team area as a reminder of where to focus their efforts toward improving their ability to deliver working software.
Closing
This article is a very brief overview of a broad topic and you will need to do additional research to determine what is most appropriate for your organization. Consider perusing the additional resources listed below and remember to only measure what really matters.
Additional Resources:
Scaled Agile Framework – Agile metrics at an enterprise level
http://scaledagileframework.com/metrics/.
Cohn, Mike. 2005. Agile Estimating and Planning
http://www.mountaingoatsoftware.com/blog/the-problems-with-estimating-business-value
 Written by Ron Montgomery, Management Consultant & Owner, OnPoint, LLC
 Ron is certified as a Project Management Professional, Agile Certified Practitioner and Certified ScrumMaster with over 35 years of hands-on experience in business planning, software development, process improvement & deployment of software solutions. By partnering with clients to drive business value from technology projects, Ron assists clients with business planning, IT strategy, project and program management, vendor selection and team training/mentoring.
Did you find this story informative? We would like the opportunity to keep you up to date on all of our training articles. Please Sign Up for our newsletter so we can do just that.
Here are some related articles you may be interested in:
Communication Essentials For Project Managers
Creating An Agile Culture: Top 3 Challenges Empowered Teams Face
Learn How Action Oriented Team Management Can Drive Timely Results.
Lessons Learned Templates & Guide: A Managers Toolkit for Continuous Improvement
Agile Methodology: A Creative Approach to Project Management
Agile Success Factors: The Product Owner Role
ManagingAmericans.com is a community of Business Professionals & Expert Consultants sharing knowledge, success tips and solutions to common job issues. Our objective is to mentor and develop professionals to be better leaders, managers, team players and individual contributors. Ultimately, helping people succeed in their careers.